
Monday Market: San Mateo County Stats
Prices are up – days on market are down!
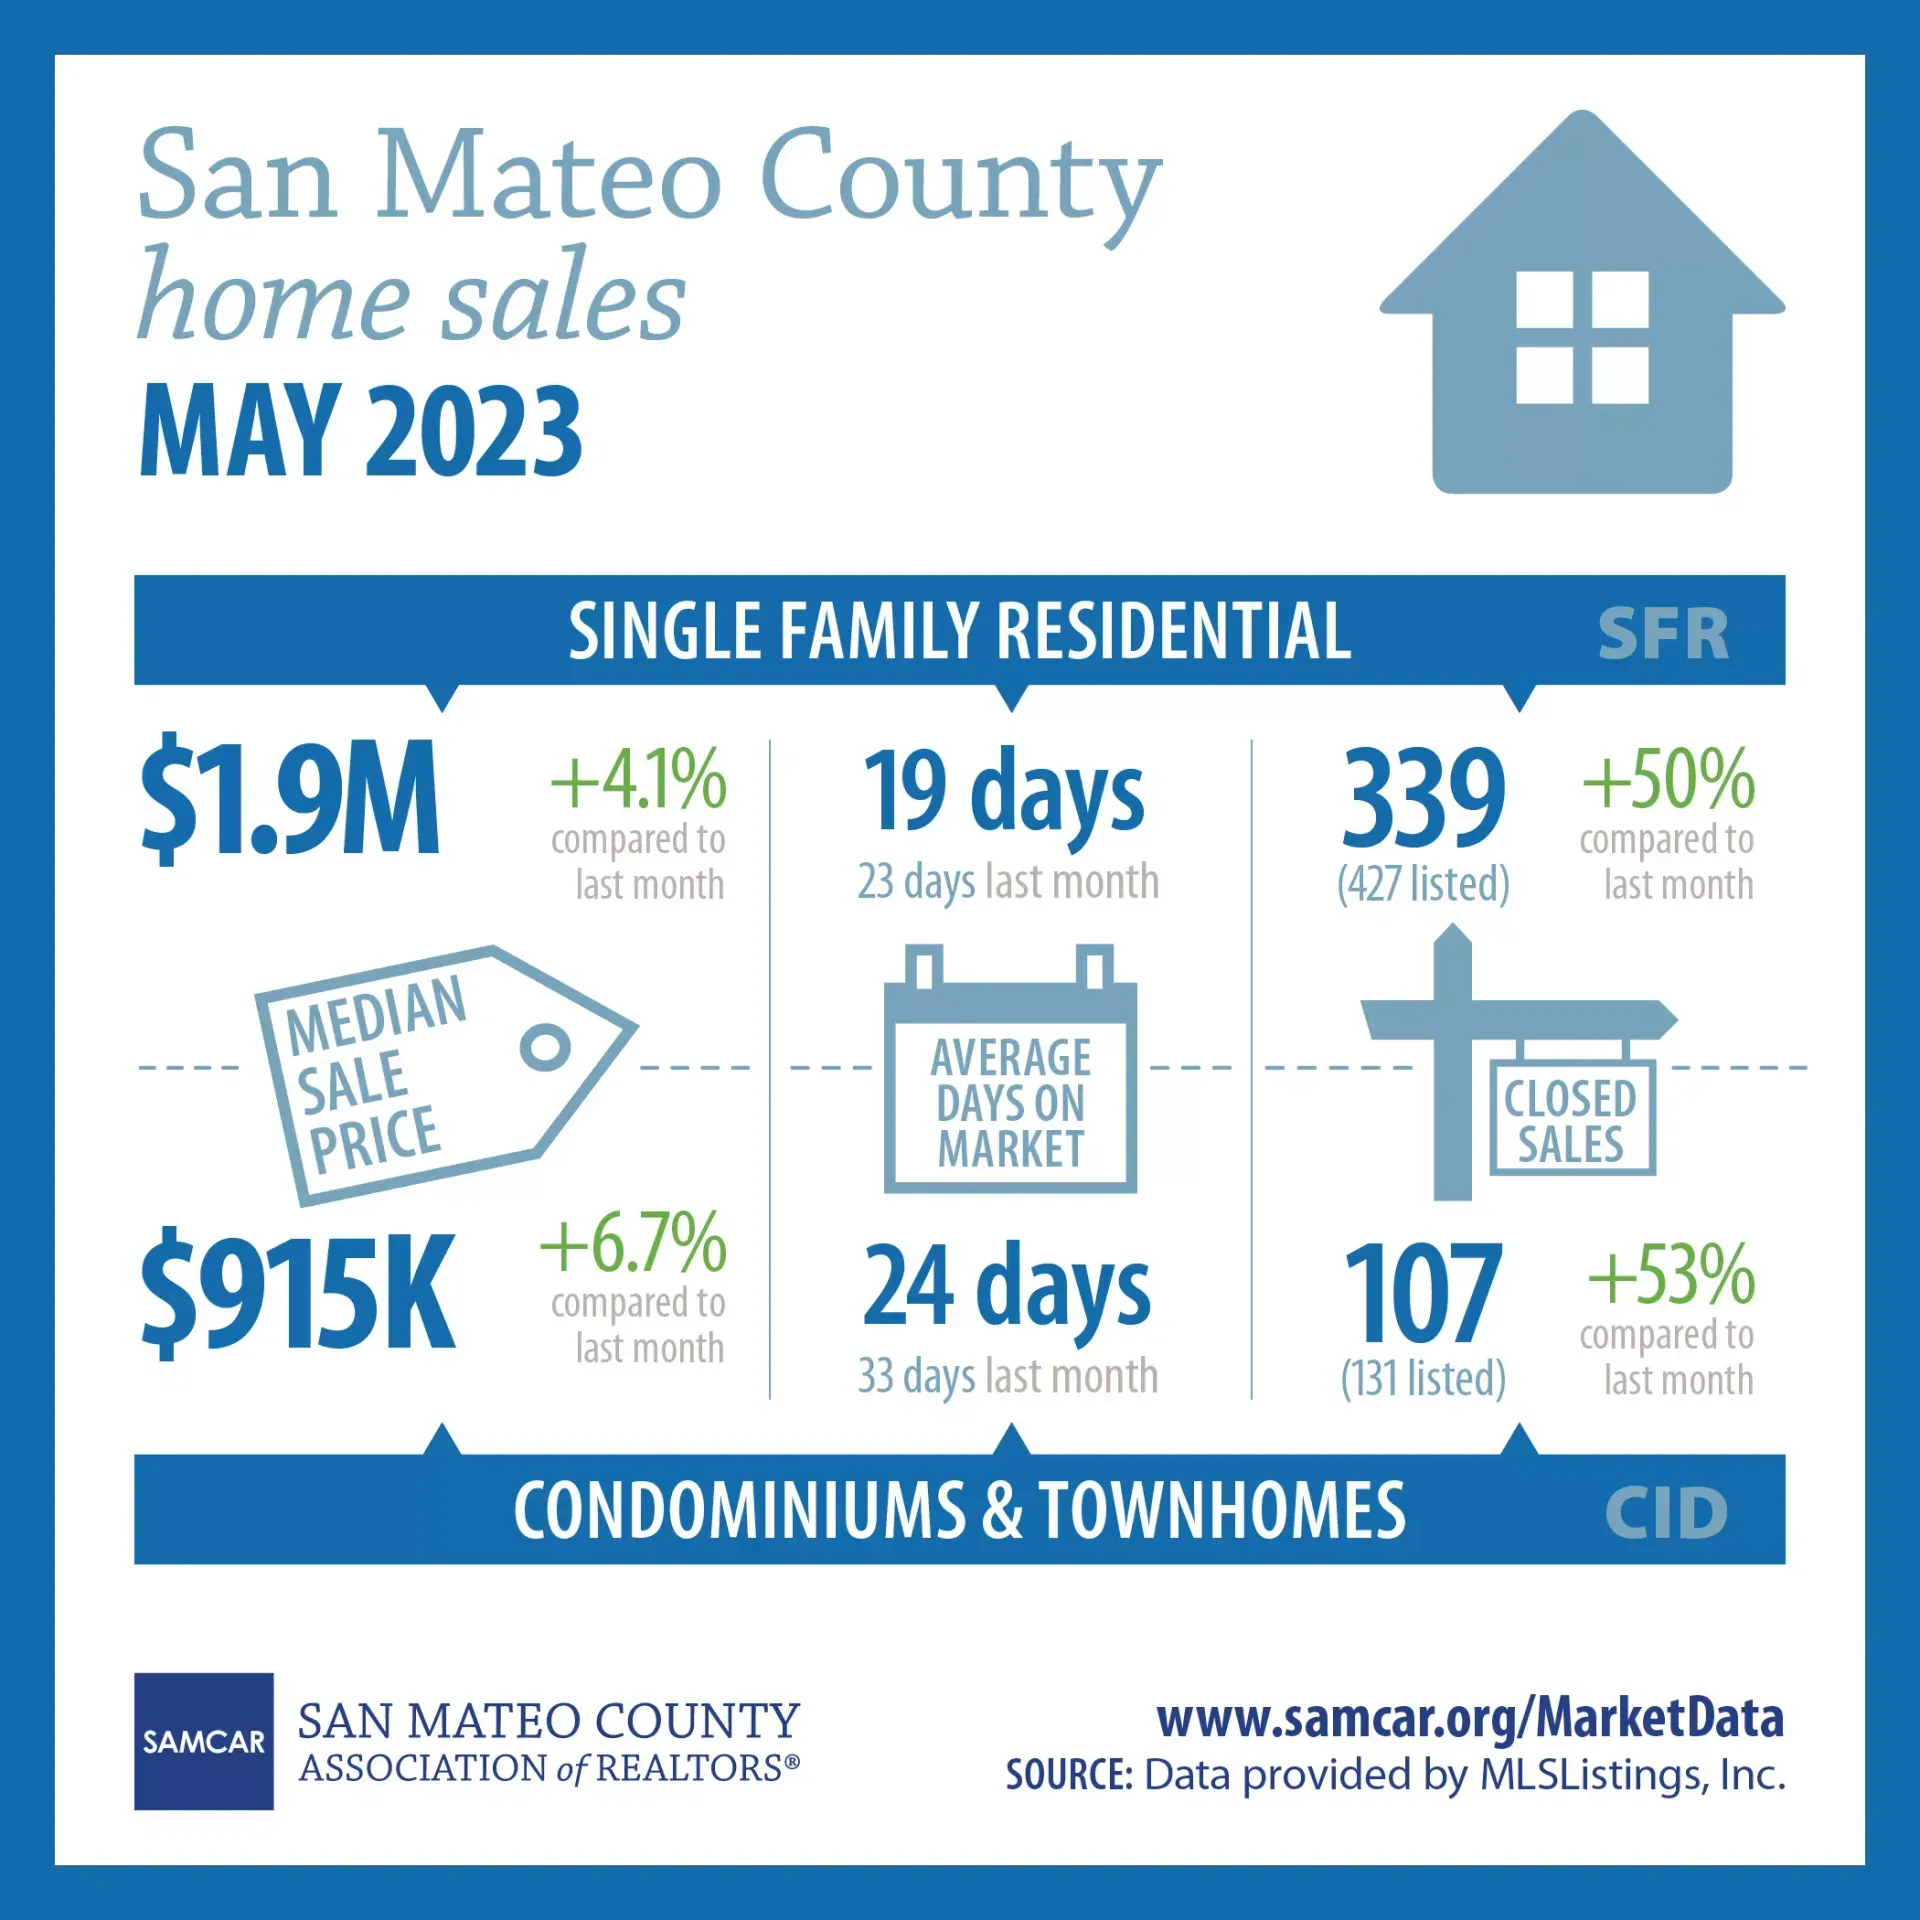
Summer is here and the San Mateo County real estate market is showing some signs of heat. Until June concludes and the data is calculated, the most recent and complete sales statistics are from May 2023 and they have a LOT to say.
Note from the infographic below median sales prices for both single family homes and multifamily properties are up month-over-month, at 4.1% and 6.7% respectively. In addition, days on market have decreased by 4 days for SFRs and 9 days for condos and townhomes. Homes selling faster for higher prices – sounds like a sizzling season is underway!
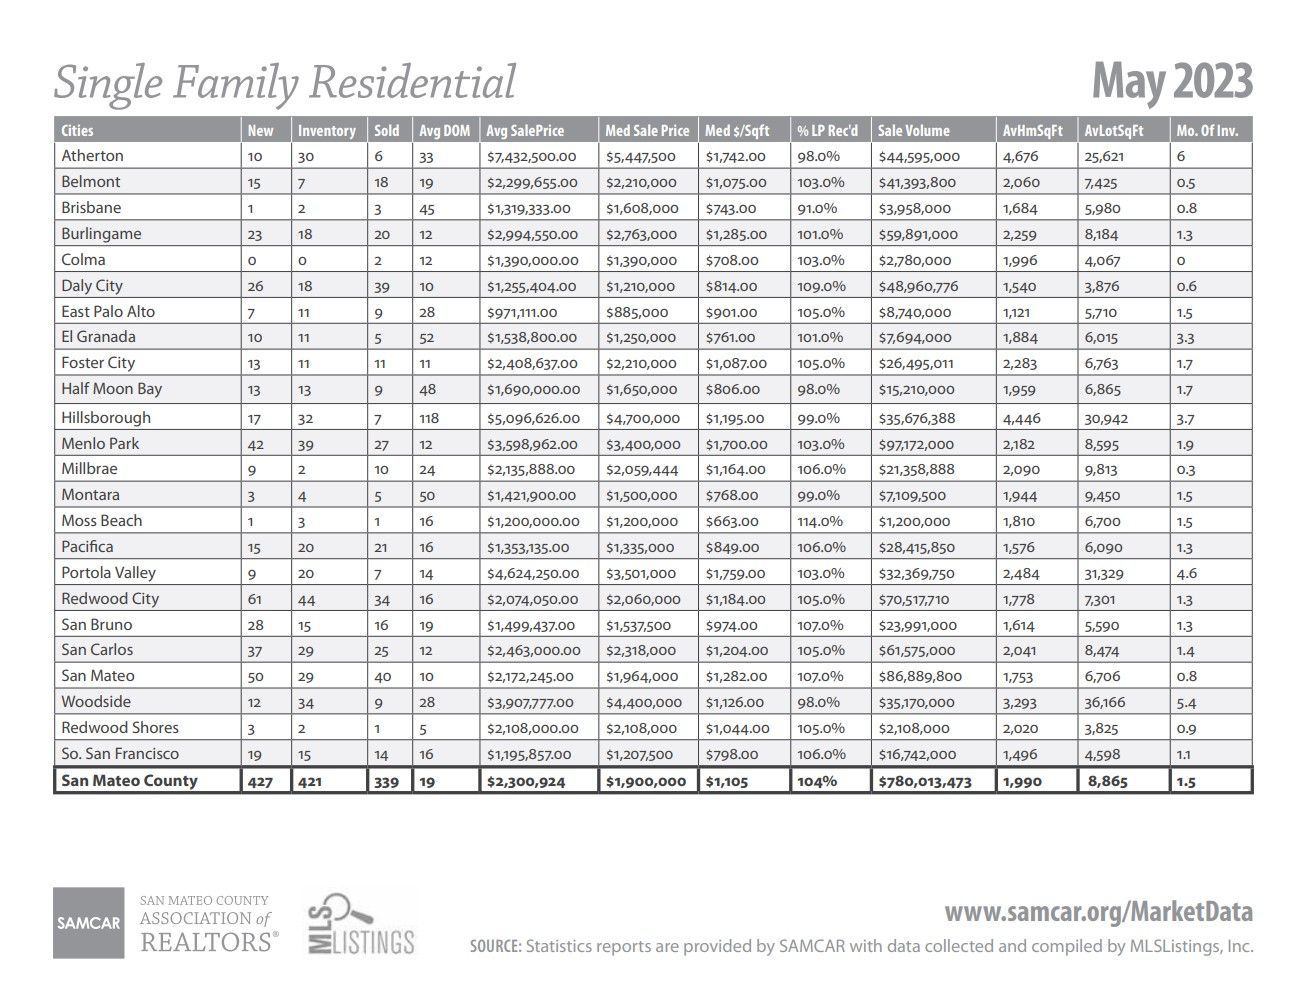
The breakdown of the cities in San Mateo County reveals that the average list-to-sales-price ratio is 104%, with most counties selling over asking. That being said, there is a handful of cities (Atherton, Brisbane, Half Moon Bay, Hillsborough, Montara and Woodside) who are averaging a sales price of less than 100% of list price. Note that in small cities with very little inventory, one property sale can impact the average largely. Thus the outliers tend to skew the data more heavily.
The other figure we want to point out is that months of inventory is only 1.5! This is the lowest we have seen in San Mateo County all year except for January at which levels were 1.4 months.
All in all… what does this data mean for you? The market is still experiencing the trends that emerge when demand outpaces supply, with homes selling faster and prices moving up. While rates are no doubt impacting affordability and halting many potential move-up buyers, the homes that are being listed are not sitting and generally selling at or above asking.
Note: Your own micromarket and personal, financial situation are the MOST important factors when calculating your real estate decisions. We encourage you to use this data to ask questions, understand where the market is at and brainstorm where your own opportunities could be headed.
All my best,
Bobbi & Team

Bobbi Decker
DRE#00607999
Broker Associate, Bobbi Decker & Associates
650.346.5352 cell
650.577.3127 efax
www.bobbidecker.com
NAR Instructor….“Designations Create Distinctions”
CIPS, SRS, ABR, CRS, SRES, GRI, CLHMS, REI, AHWD, RSPS, MSLG
Bobbi Decker & Associates fully supports the principles of the Fair Housing Act and the Equal Opportunity Act. For more information, please visit: http://portal.hud.gov/

Bobbi's Blog