Monday Market Update: San Mateo County Market Stats
See the latest San Mateo County real estate stats in a snapshot right here!
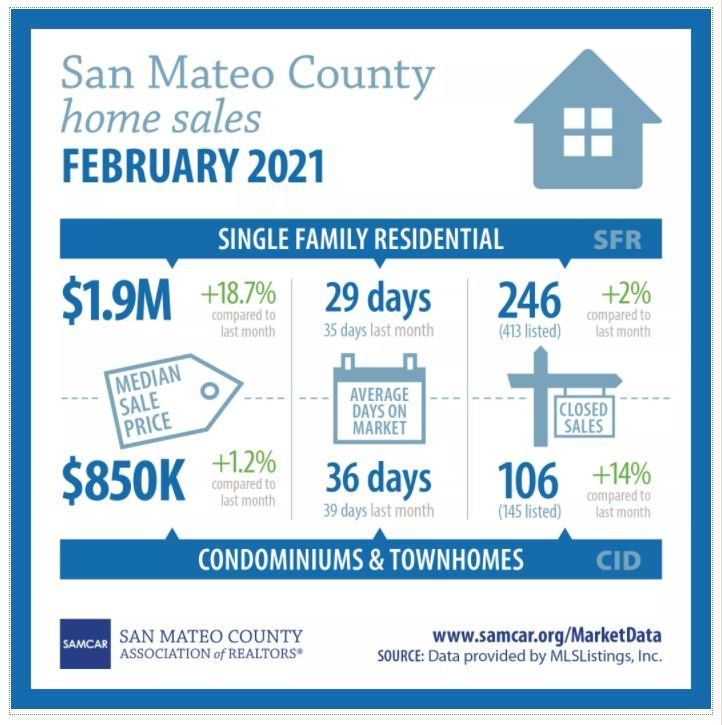
Spring is almost here and the Silicon Valley real estate selling season is already well underway. This week, we wanted to provide a local snapshot of the market based on the most recent data available from February 2021 (March is obviously still in the works!).
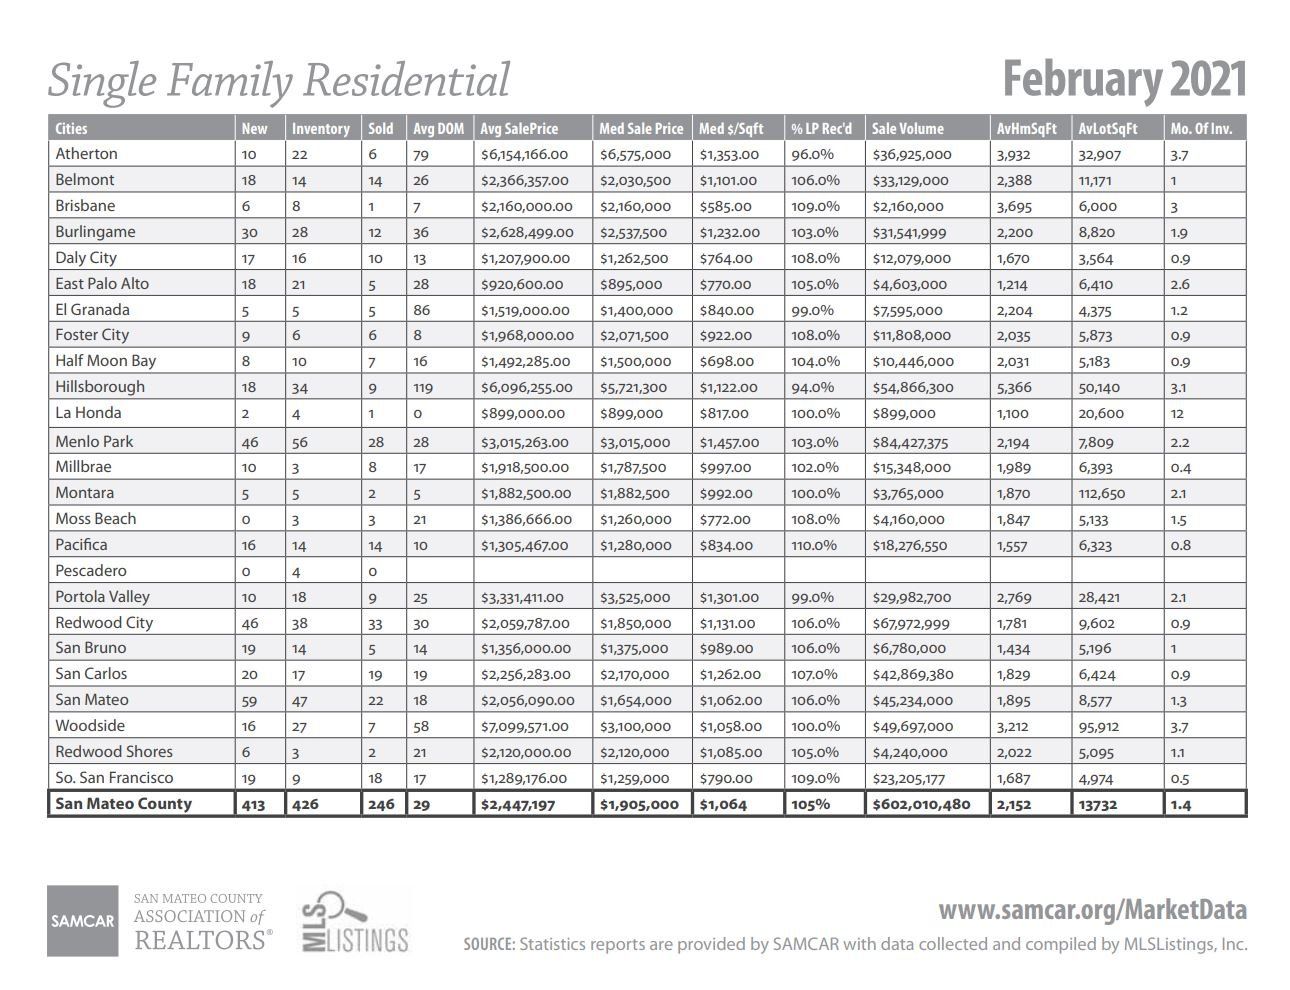
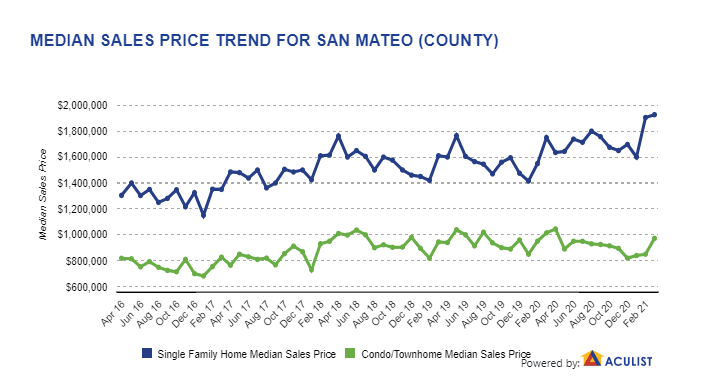
Below you will find infographics that summarize the pricing and inventory trends in both the condo and SFR sectors last month. As you can see, single family homes are rising more quickly in price, are spending less time on the market and have less inventory. Condo prices are rising more slowly, are on the market about a week longer than SFRs and are increasing in inventory at a higher rate.
While condos have traditionally represented entry level home ownership in Silicon Valley, the trend towards SFR demand has been liked to the pandemic and people wanting & needing more space. Many move-up buyers are also selling their condos and upsizing before rates rise any further.
Note that condos are still selling at 101% in sales-to-list price ratio, and still increasing in price month over month.
When you look at the summary below of last year’s stats – remember that our spring selling season had not started as early as this year AND we were in the beginning stages of shut down.
Resource Used: SAMCAR Market Data, #SAMCARSTATS
Market Snapshot: February 2021 vs. February 2020
San Mateo County
SFR Inventory: +6% Condo Inventory: +63%
SFR Median Price: +23% Condo Median Price: -11%
SFR Days On Market: -18% Condo Days On Market: +7%
SFR % List Price Received: Same Year Over Year/ 105%
Condo % List Price Received: -2%/101%
Resource Used: MLS Listings Market Report
We know this is a LOT of information and we know that some people like to study the numbers for themselves, while others just want to know what all of this means for them. If you are in the latter, please do not hesitate to reach out and we can guide you towards the data that is most relevant to your micro market and your own buying and selling goals.
Empowering with education and creating clarity are my favorite things to do! 😉
All my best,

Bobbi Decker
DRE#00607999
Broker Associate
650.346.5352 cell
650.577.3127 efax
www.bobbidecker.com
NAR Instructor….“Designations Create Distinctions”
CIPS, SRS, ABR, CRS, SRES, GRI, CLHMS, REI, AHWD, RSPS, MSLG
Bobbi Decker & Associates fully supports the principles of the Fair Housing Act and the Equal Opportunity Act. For more information, please visit: http://portal.hud.gov/

Bobbi's Blog