
Monday Market Buyers: The Middle Income Issue
Inventory issues remain for middle income buyers.
Not all housing inventory is created equal. You may have seen in the news that the number of homes listed for sale across the nation has risen compared to this time last year. But that surge is not universal or consistent across regions or within income brackets.
How Much Has Supply Grown?
Earlier this month, Realtor.com® reported that the number of homes actively listed for sale was up 31% in April 2025 compared to April 2024. (Note this is still 16% lower than pre-pandemic levels.) Last month marked the 18th consecutive month for housing supply growth – marking a new post-pandemic high across the nation. Total sale inventory (which includes listings plus homes in contract) increased 20% year-over-year as well.
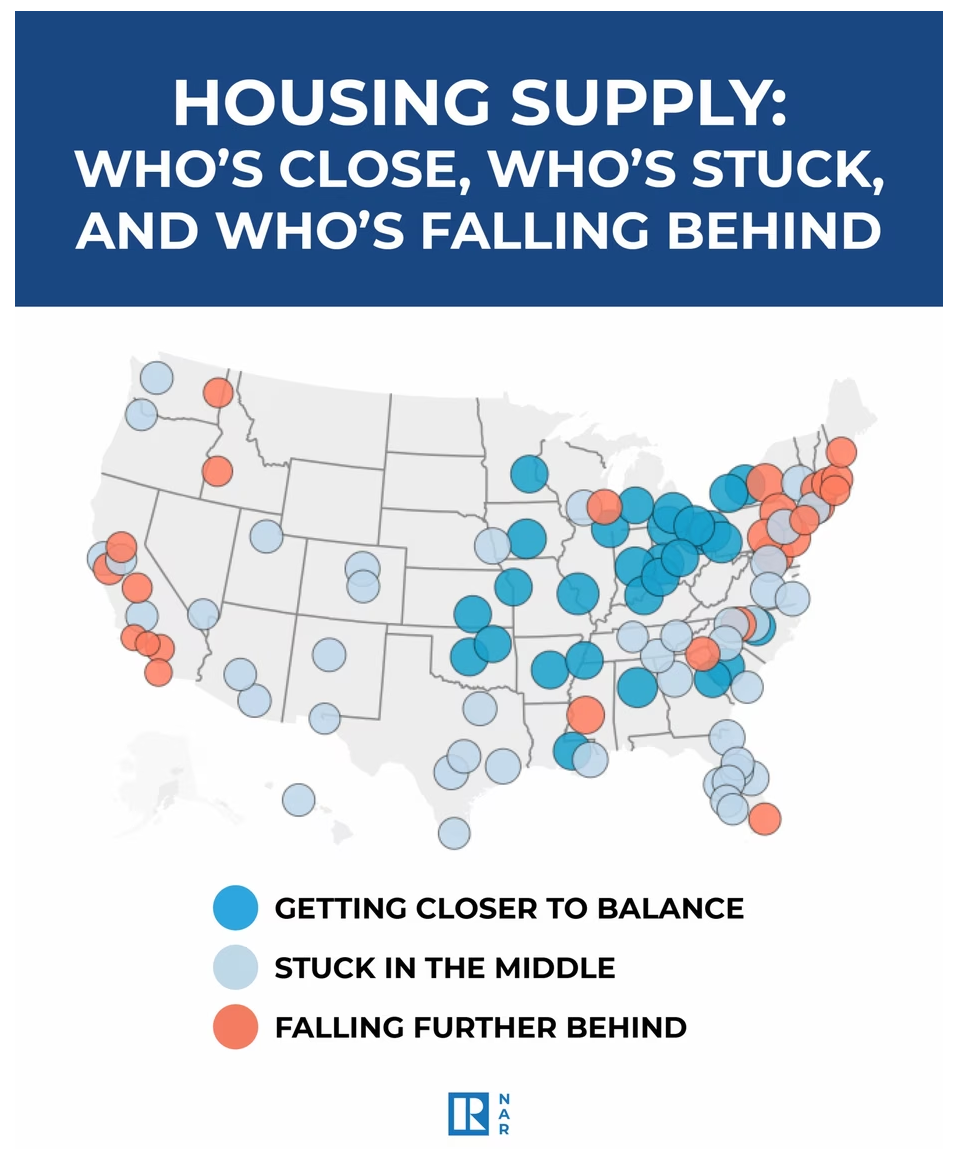
What Does This Mean For Middle Income Buyers?
While overall supply may be up, a shortage of homes for middle income buyers remains. A new report from Realtor.com® reveals that “millions of middle-class homebuyers still face a significant shortage of homes in their price range.” Households that earn $75,000 per year can afford just 21% of the nationwide listings, a figure that would have been 49% of listings in 2019. Furthermore, out of the 100 largest metros in the country – the only two metros that even have enough supply at a mid-income price point are Akron and Youngstown, Ohio! Households that earn $100,000 per year can afford 37% of national home listings, a figure that would have been 65% in 2019.
In a balanced market, buyers who earn $75,000 per year should be able to afford 48% of all homes for sale in the US, while those earning $100,000 should be able to afford 61% of the homes for sale in the US.
Realtor.com® reports that meeting demand for those earning $75,000 a year would mean adding 416,000 additional homes priced below $260,000. For those making $100,000 a year - the market would need an additional 364,000 home listings priced below $340,000 to meet demand from buyers in this income group.
To read more about market supply and affordability in the present and over time, please read the article from Realtor.com® in full here.
Have a great week,
Bobbi

Bobbi Decker
DRE#00607999
Broker Associate, Bobbi Decker & Associates
650.346.5352 cell
650.577.3127 efax
www.bobbidecker.com
NAR Instructor….“Designations Create Distinctions”
CIPS, SRS, ABR, CRS, SRES, GRI, CLHMS, REI, AHWD, RSPS, MSLG
Bobbi Decker & Associates fully supports the principles of the Fair Housing Act and the Equal Opportunity Act. For more information, please visit: http://portal.hud.gov/

Bobbi's Blog